Adding group E to an A to get channels 55 &56
March 31 - May 2 2018
SIDE VIEW BEFORE ADDITION |
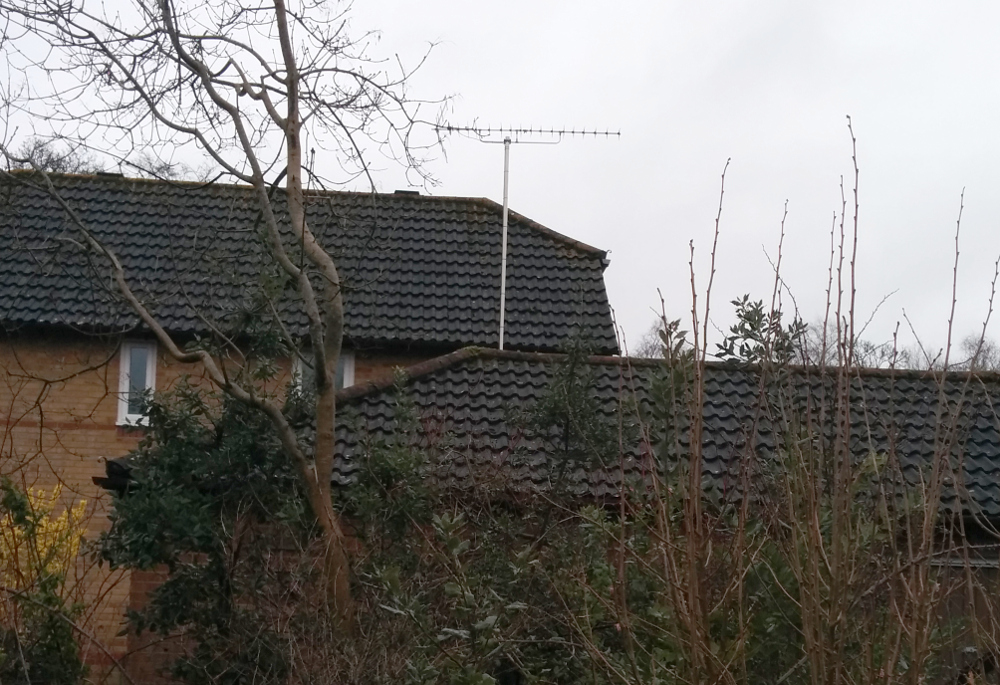 |
This is an XB16A aerial (sold by A.T.V.) |
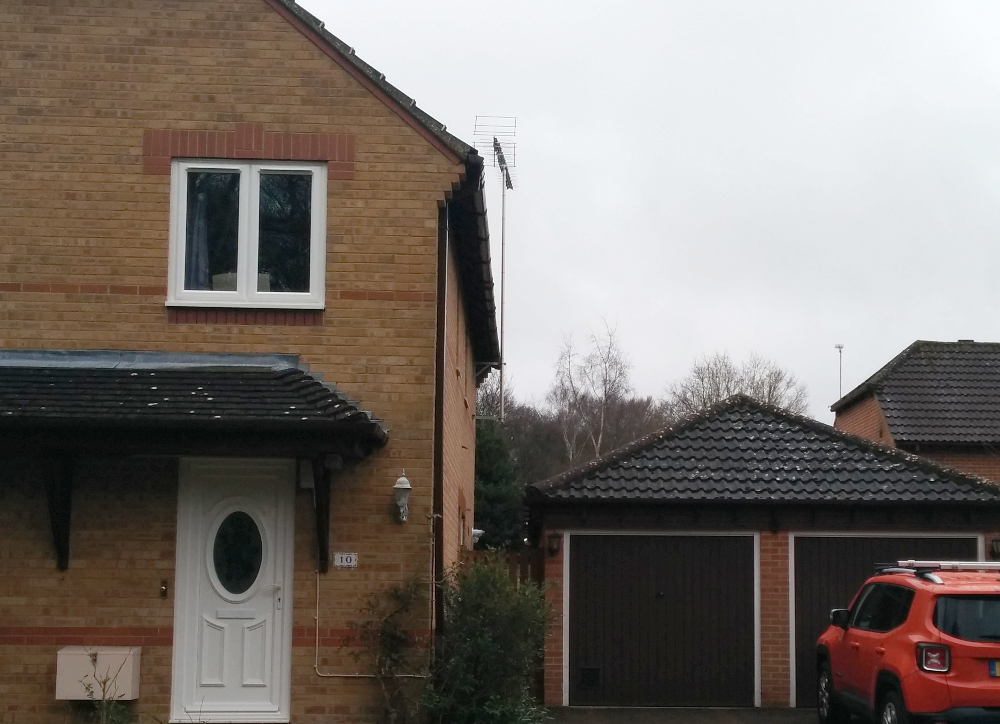
REAR VIEW BEFORE ADDITION |
 |
UNDERSIDE VIEW BEFORE ADDITION |
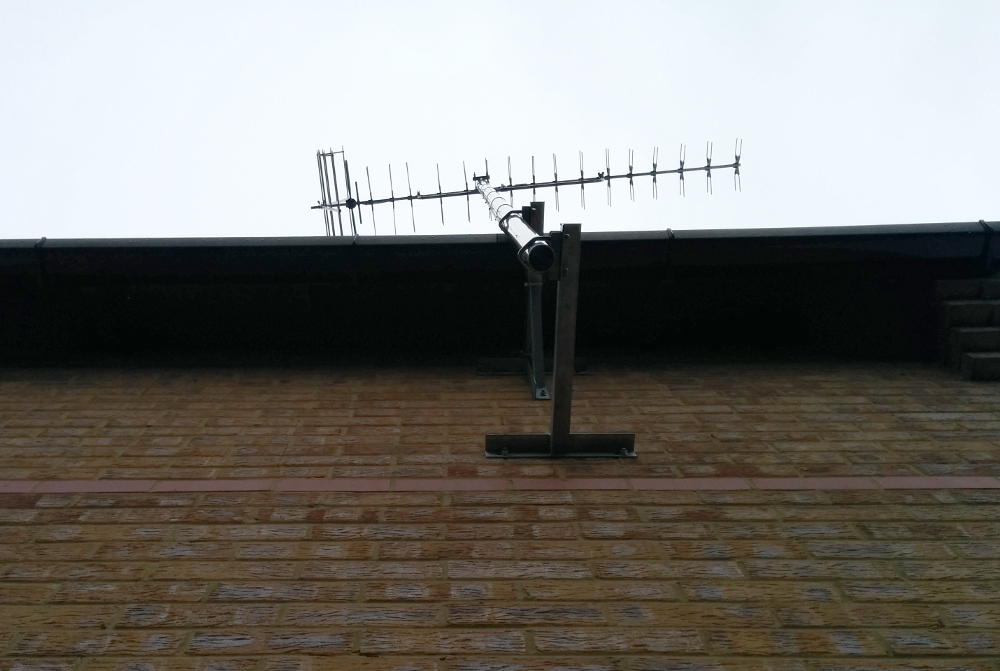 |
The complete system as seen at this time is the XB16A, downlead into loft, Fringe Electronics WB22/2 (I think) amplifier,
downlead to living room, passive splitter to two Humax FOX-T2 Freeview boxes. |
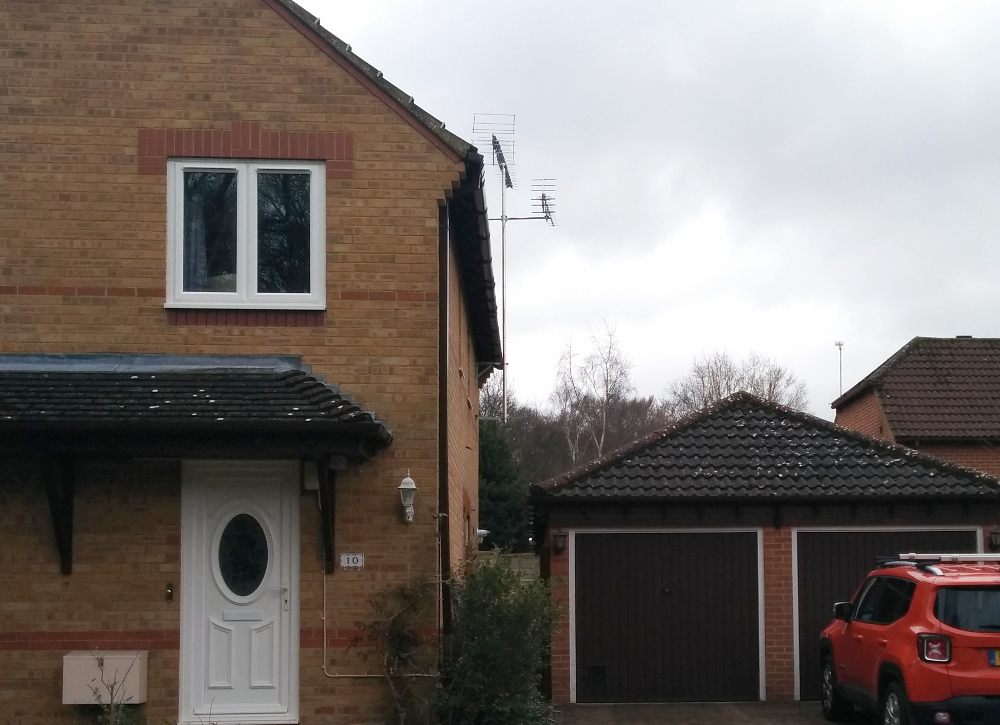
SIDE VIEW AFTER ADDITION |
 |
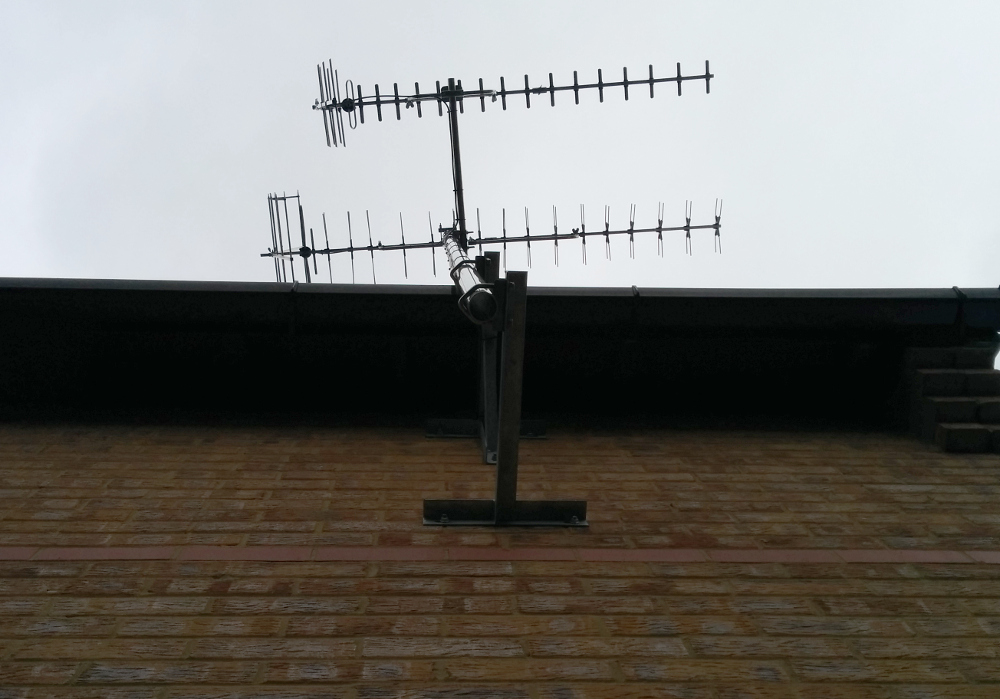
The addition is a Yagi 18E aerial (sold by A.T.V.) |
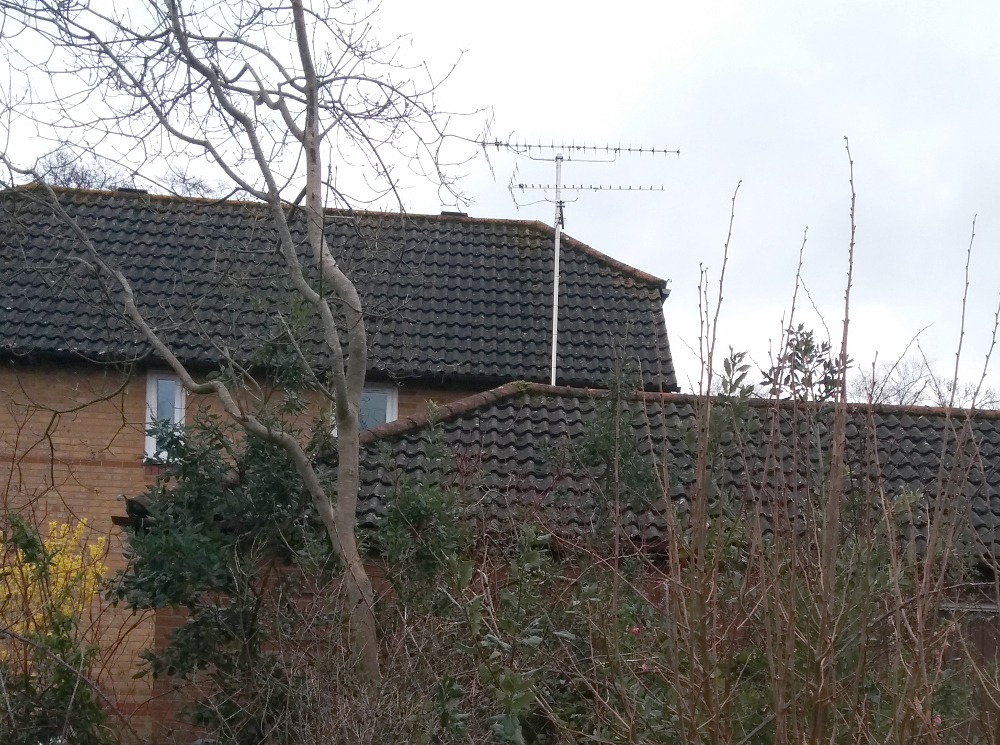
REAR VIEW AFTER ADDITION |
 |
UNDERSIDE VIEW AFTER ADDITION |
 |
The complete system now is the XB16A with downlead into loft as before, new Yagi 18E with downlead into loft, the two aerial downleads into a Fringe ch 38 Diplexer, short lead across to the Fringe Electronics amplifier, then downlead to living room, passive splitter to the two Humax FOX-T2 Freeview boxes as before. |
LOFT ELECTRONICS AFTER ADDITION |
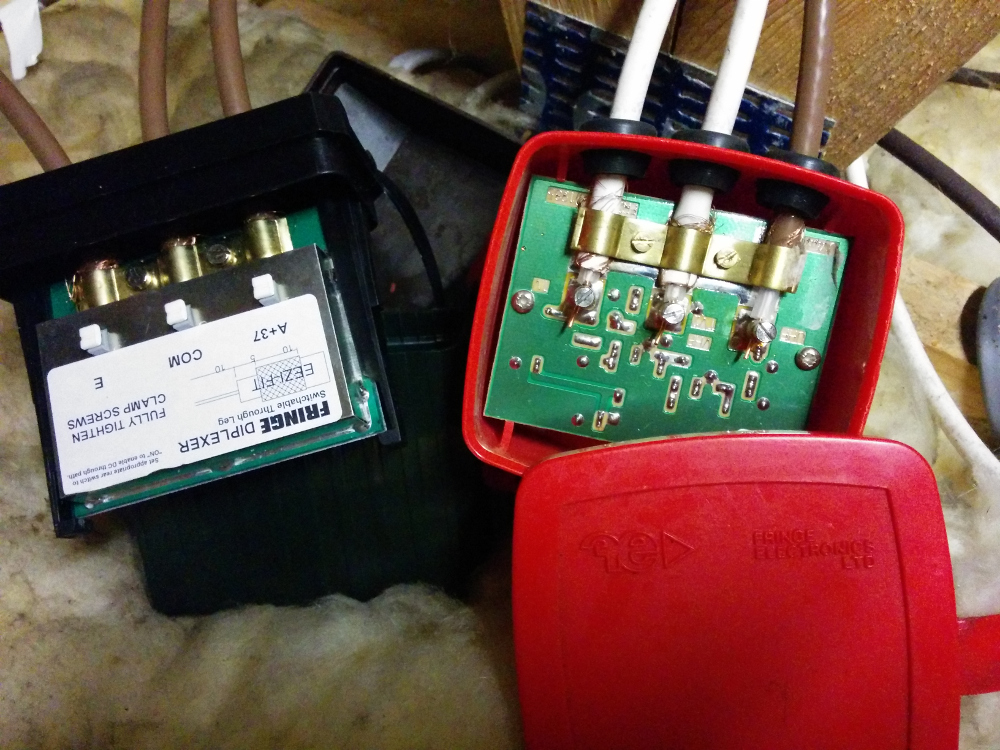 |
Diplexer on left, amplifier on right. The output of the diplexer (centre lead) loops round out of the top of the picture
and comes back to the input of the amplifier (right lead). |
Results (now updated for Final, 2 May 2018)Measurements of the relative signal strengths were taken at three points during the work, which spanned several hours. The readings are those shown in the signal detection section of one of the Humax boxes. The readings are shown as % but it
is not known what the calibration is; ie. we don't know how they relate to a dB scale for example. The values tend to fluctuate a few % and I have shown
the 'most-of-the-time' spans. The left column is the channel numbers. These are for Rowridge with 55 & 56 being the new locations for COM 7 & COM 8 (from 31 & 37).
The first three result columns are from April when only COM 8 had moved to 56 and the local (L-SOT) mux had moved from 29 into 37. The last column is when
COM 7 had also moved (to 55) in May. The results in April are good. The diplexer is specified to lose about 1dB and this seems to equate to a couple of % at the Humax (though I don't know if the amplifier is linear). The extra aerial has pulled in ch 56 well, considering COM 8 seems to be at reduced power/coverage until early 2019. All the received channels were showing 100% quality, which is the important thing. The final readings (May) are a little odd as all the channels are showing a 6-7 point increase (see note above about ch 28). I assume this is due to atmospheric
effects as the coverage checker isn't showing any change in mux powers. I was expecting lower numbers if anything since the trees now have leaves. Also odd is that
COM 7 (55) is listed at 25kW and COM 8 (56) at 20kW ... but the numbers suggest the reverse. Possibly the polar distributions of these two are different. |
|
Signal % |
||||
|---|---|---|---|---|
|
Channel |
Before |
Installed |
Completed |
Final |
|
21 |
80-81 |
79-81 |
78-80 |
84-86 |
|
22 |
72-73 |
72-73 |
71-73 |
77-79 |
|
24 |
80-82 |
81-83 |
80-81 |
85-86 |
|
25 |
72-73 |
72-74 |
70-73 |
77-79 |
|
27 |
74-76 |
75-76 |
72-73 |
80-82 |
|
28 |
54-67 |
55-67 |
52-54 |
70-72 |
|
31 |
70-71 |
71-71 |
68-70 |
NA |
|
37 |
42-43 |
43-45 |
43-45 |
47-49 |
|
55 |
NA |
NA |
NA |
51-53 |
|
56 |
0 |
0 |
48-50 |
52-54 |
Copyright Mike Sheridan, 2018